The LIMS*Nucleus client is distributed and installed as a Guix
Package. The name of the LIMS*Nucleus package is ‘limsn’. For the
package to be available to your system, you must first modify your channels.scm file to include
the labsolns channel. You can then issue the install command:
1
guix package -i limsn
This will install not only LIMS*Nucleus but also all of its
dependencies, as well as configuration scripts and sql scripts for
setting up the database. You may have already set up the database in which case you only
need to configure artanis.conf. The
sequence of scripts that need to be run are:
Sequence
Script Name
Function
1
init-limsn.sh
create directories that hold temp files and the configuration file;
modify .bashrc
2
install-pg-aws.sh
install the Postgres database; install-pg-aws.sh is designed for
AWS, there are other options
3
start-limsn.sh
start the client; run in background mode if desired with
‘nohup’
Other options, such as the AWS installation
script will automatically run the init-limsn.sh and
install-pg-aws.sh scripts for you.
A sample database, not suitable for personal data, is provided on
ElephantSQL. For personal use, the vendors below provide support for
PostgreSQL for a fee.
This page discusses the guidelines for writing an Artanis application
such as LIMS*Nucleus that is suitable for Guix packaging. If you are
looking for modifications needed in the Artanis source code, look here.
Write a Guix
packageable Artanis application
First read the discussion on
modifications required to the Artanis source code so you are aware that
all temporary files created by your application must be moved to a
directory outside the application directory. In addition, Artanis’ cache
must be move outside the application directory, as well as artanis.conf
so it remains editable. These activities can be handled with a post
installation initialization file.
One time initialization
Because your artanis app needs some directories outside of the
application directory to work with temporary files, configuration files
etc., a one time initialization script can be run to set up your server.
The overall process would look like:
guix package -i limsn
init-limsn.sh
install-pg-aws.sh
start-limsn.sh
The initialization file would create required directories and copy
over the artanis.conf file. Note that the placeholder PATH_INTO_STORE is
replaced on installation by the path into the store.
Because a configuration file outside the project directory is being
used, you can use a startup script to launch your application:
start-limsn.sh
1
2
3
4
5
6
#!/bin/bash
!#
export LC_ALL="C"
mkdir -p /var/tmp/limsn/tmp/cache
cd PATH_INTO_STORE/share/guile/site/3.0/limsn
art work -h0.0.0.0  --config=$HOME/.config/limsn/artanis.conf
In this example -h0.0.0.0 is needed for running on Amazon Web
Services
GNUPLOT
With regular Artanis Gnuplot can be run on the server and generate
*.png files in the ../pub directory that are accessible to the .html.tpl
file via:
page1.html.tpl
1
<imagesrc= <%= myplot %>>
Where in the above snippet the variable myplot ==
“../pub/myplot.png”. With guix modified Artanis, the .png file would
have to go into /tmp/limsn and would become inaccessible due to security
restrictions. To get around this, load the myplot variable with svg
commands. This is accomplished by first creating the gnuplot script with
the following commands:
my-gnuplot-script.txt
1
2
3
4
5
6
reset session
set terminal svg size 800,500
save '-'
set key box ins vert right top
set grid
...etc.
The ‘save’-’’ statement will save to standard output so that you can
pipe into your variable. Here is a helper function that will collect the
svg commands:
Now in the above snippet myplot-svg == ’<svg width=“600”
height=“350” viewBox=“0 0 600 350” xmlns=“http://www.w3.org/2000/svg”
xmlns:xlink=“http://www…etc….”
Application specific
variables
Application specific variables are defined in ENTRY such as:
ENTRY
1 2 3
...
(conf-set! 'maxnumplates 100)
...
Since ENTRY is in the store, this will only work for variables that
are not available to the end user for (re)setting. To provide editable
application specific variables, put them in artanis.conf. Variables are
grouped in artanis.conf. LIMS*Nucleus specific variable ‘maxnumplates’
is placed in the ‘cookie’ group for convenience, even though it is not a
cookie.
(substitute*"artanis/config.scm" (("debug.monitor = <PATHs>\")") "debug.monitor = <PATHs>\")\n ((cookie expire)\n 3600\n \"Cookie expiration time in seconds.\n 1 hour is 3600\n 6 hours 21600\n 1 month 2592000\n cookie.expire = <integer>\")\n\n ((cookie maxplates)\n 10\n \"Maximum number of plates per plate-set.\n cookie.maxplates = <integer>\")"))
Modify controller syntax
Controllers as they are written will generate a warning:
guix package: warning: failed to load ‘(limsn app controllers
plates)’: no code for module (lims app controllers plates)
/home/mbc/.guix-profile/share/guile/site/3.0/myapp/app/controllers/pages.scm:4:0:
warning: module name (app controllers plates) does not match file name
‘limsn/app/controllers/plates.scm’ hint: File
`/home/mbc/.guix-profile/share/guile/site/3.0/limsn/app/controllers/plates.scm’
should probably start with: (define-module (limsn app controllers
plates))
Guix expects the first statement in a module to
begin with (define-module ()….) Artanis wants modules
to (use-modules (artanis mvc controller)) Satisfy both requirements
with:
;;error: define-artanis-controller: unbound variable ;;hint: Did you forget `(use-modules (artanis mvc controller))'?
(define-artanis-controller pages) ; DO NOT REMOVE THIS LINE!!! ;;libraries must be imported after define-artanis-controller (use-modules (myapp lib mylib) )
(pages-define plates (lambda (rc)......etc.
Be sure to import libraries after (define-artanis-controller
)
Make Libraries accessible
Artanis provides the …./lib directory to hold
libraries. This directory is placed on the GUILE_LOAD_PATH for you. To
avoid warnings, you may wish to write your library as a module
e.g. (define-module (limsn lib mylib)…) in which case you need to place
your project directory on GUILE_LOAD_PATH with a statment in ENTRY such
as:
Note: These modifications are incorporated into
Artanis v1.0.0 (2025)
This page discusses modification to the Artanis web server softare
required for packaging an Artanis application. Guidelines for writing a
Guix compatible Artanis application can be found here.
Artanis
GNU Artanis is a web
server written in Guile (a scheme dialect). Artanis -the web server
software - has been packaged for Guix. The packaging recipe can be found
in …/gnu/packages/guile-xyz.scm. Artanis applications such as
LIMS*Nucleus are not by default packageable by guix due to the presence
of a writeable ../tmp directory in the application folder. Here is the
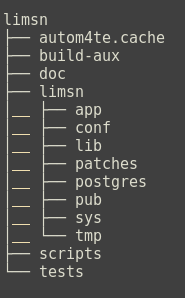
partial directory structure of LIMS*Nucleus:
The directory ../limsn/limsn/tmp holds temporary files created while
users are navigating the application. Since the Guix store is immutable,
a temporary folder is not allowed and must be moved outside of the
application. Artanis defines a variable ‘current-toplevel’ which, in the
above example would be ../limsn/limsn. In the labsolns modified artanis
all references to ‘current-toplevel’ are divided into two groups:
variable
description
1
current-toplevel
redirected to /tmp/limsn i.e. references that create a temporary
file
2
immutable-toplevel
references that point to the original ‘current-toplevel’
i.e. references that do not create files and can reside in the immutable
/gnu/store… directory
Source Code Modifications
To allow for Guix packaging of Artanis applications the following
modifications to the Artanis source code are introduced during
packaging:
;;============START forguix mods========================================================================= ;;immutable-toplevel is the original current-toplevel in /gnu/store ;;current-toplevel is the mutable toplevel in /tmp/<appname>/tmp/cache
(Static
IP address) A transient IP is adequate and will be used in the video tutorial. Consider a static IP for production. A
static IP address is free upon request, but must be used on a running
instance. You will be charged for a static IP that is requested but not
used.
Credit card number - a valid credit card is required to register.
Note that these are Amazon requirements.
Installation
Note: the video tutorial
of AWS EC2 installation of LIMS*Nucleus describes installation of an
older version of LIMS*Nucleus. Though still useful to watch as the
overall process and many details are the same, details discussed below
supercede what is in the video. The main changes are different names for
scripts are being used, LIMS*Nucleus is now packaged as a guix module
and so is installed in the store, and because a guix pull must be
performed the free tier t2.micro may not provide enough memory. Use
t2.medium.
Local: download the archive of install
scripts and transfer to AWS with scp:
install-limsn-ec2.sh and guix-install-mod.sh must be in the same
directory. Multiple files described below are loaded into the store at
PATH_INTO_STORE/limsn/scripts
Supplied Scripts
Scripts available on this website or in /gnu/store are described on
the scripts page.
LIMS*Nucleus characterizes two types of users, regular users and
administrators. LIMS*Nucleus users are unique to LIMS*Nucleus and not
shared with the operating system nor database. Administrative
functionality is listed in the table below.
Item
Description
Add User
Add a user and password
View all users
Add Project
Add a new project; users cannot create projects, only use them
Calculate the average of all wells labeled “blank” to obtain
plate specific backgound signal
Subract backgound from all signals to obtain background
subtracted values (bkgrnd_sub below) which are used in all further
calculations
Set all background subtracted values that are less than zero to
zero
(4.5 For layouts utilizing duplicates (2S4T,
4S2T), average the duplicates)
Calculate norm, norm_pos, p_enhance as described below
Background subtraction,
normalization
Upon data import, raw values are stored and processed as described
above, then the calculations below are performed to yield additional
columns of stored data.
column
Description
raw
imported raw data
bkgrnd_sub
mean of all wells annotated “blank” subtracted from each raw
value;
norm
all values normalized to the maximum of the background subtracted
values annotated as “unknown”;
norm_pos
all values normalized to the mean of the background subtracted
values annotated as “positive”;
p_enhance
Percent enhancement over the positive control; 100*(
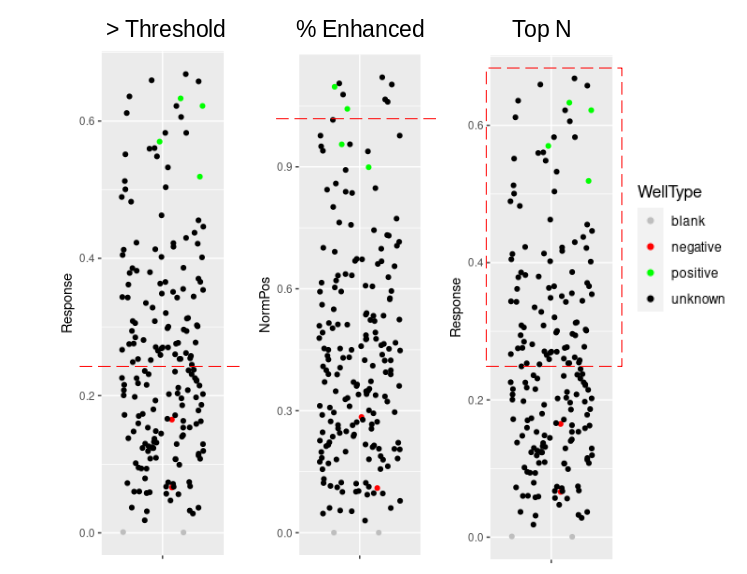
Hit identification
Algorithm
Label
Hit threshold
mean(neg) + 3SD
mean(neg) + 2SD
>0% enhanced
Top N
Highest N responses from unknowns
### References
Sittampalam GS, Coussens NP, Brimacombe K, et al., editors. Assay
Guidance Manual Internet.
Bethesda (MD): Eli Lilly & Company and the National Center for
Advancing Translational Sciences; 2004-.
Brian P. Kelley, 1 Mitchell R. Lunn, 1 David E. Root, Stephen P.
Flaherty, Allison M. Martino, and Brent R. Stockwell; A Flexible Data
Analysis Tool for Chemical Genetic Screens, Chemistry & Biology
11:1495–1503, November, 2004
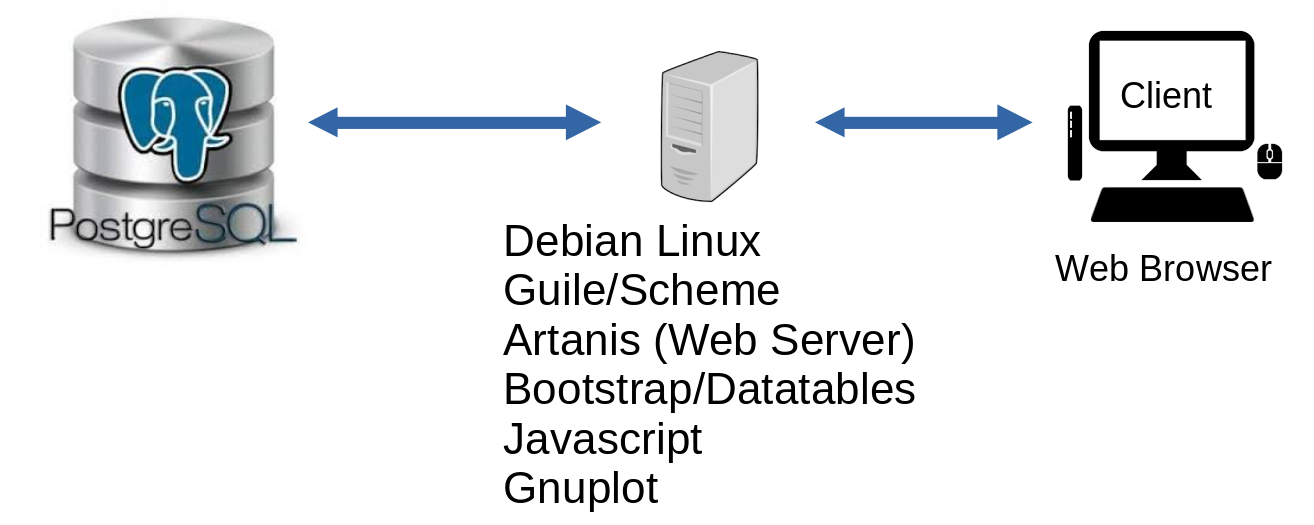
LIMS*Nucleus is amenable to a variety of installation
configurations:
Example
Client
Server 1
Server 2
Data Center
Web Browser
Application Server
Database Server
AWS/EC2
Web Browser
Application & Database Server
Personal laptop
Browser, Application & Database Server
Most of the LIMS*Nucleus business logic is implemented using Postgres
stored procedures. The client utililizes Bootstrap/Datatables to
guide/validate user input, and display results in table format.
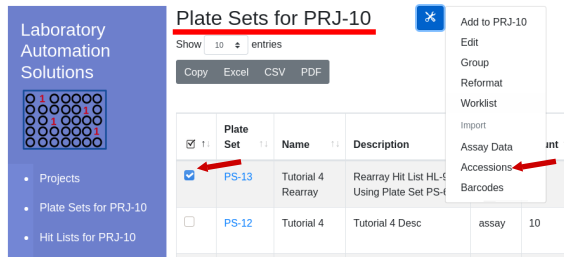
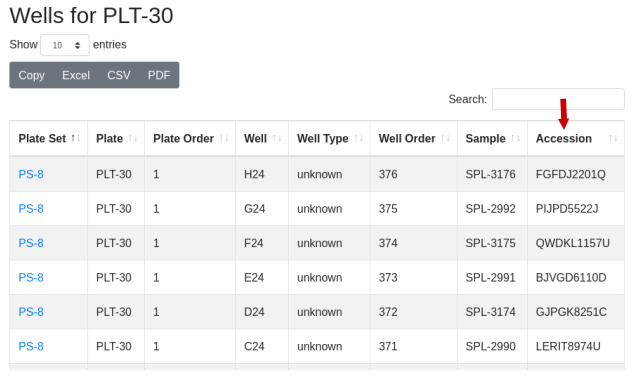
Accession IDs are imported by plate number/well number. The files page provides details on the file
format, with a 2 plate sample file
available. Navigate into the project of interest and select the plate
set of interest. From the tool icon select Accessions under import:
A standard file import form will
open - find the file and click submit. The number of lines expected will
be calculated by querying the sample id count for the plate set. For
example a plate set of two 96 well plates with 4 control wells per plate
(no sample ids for controls) will require 2x(96-4)=184 accession ids.
The control wells should not be included in the import file. For example
a portion of the accession import file looks like: